This post is the 4th and final part a series giving an overview of the most useful iOS app pentesting tools. We will start with an introduction to binary analysis with ‘Hopper’, then we will move into debugging app store apps using ‘lldb’. I want to note that I won’t be going in depth into ARM and assembly code in general, as it simply would not fit into this post – however, I will refer you to other sources to learn about it.
The series will be assuming that the user is using Electra jailbreak. I am specifically using iOS 11.1.2, but most of the tools in the series should work on any version of iOS 11.
1: Hopper Disassembler
In this tutorial we’ll be using Hopper Disassembler. Hopper is a decompiler and disassembler that will allow us to view the assembly code of a cracked app’s binary.
You can download Hopper here:
The free version will do just fine for our purposes – with pro you will gain features allowing you to patch binaries, but it isn’t necessary for basic analysis and debugging.
Once you’ve installed Hopper, we are ready to begin analyzing our chosen target app. In Part 1, we decrypted an app with bfinject and downloaded the .ipa/.zip file to our computer. Now we can open Hopper, go to File -> Read Executable To Disassemble and select the app binary. Remember that the app’s binary is located inside the file we downloaded from our device, in Payload/AppName.app. The binary will simply be called ‘AppName’ with no file extension.
Now, we will have to wait for Hopper to do its thing – disassembly can often take a while, and the time depends on the size of the app and your computer’s specs.
When disassembly is complete, you should see this at the bottom of the Hopper window:
> dataflow analysis of procedures in segment __DATA
> dataflow analysis of procedures in segment __LINKEDIT
> dataflow analysis of procedures in segment External Symbols
> Analysis pass 9/10: remaining prologs search
> Analysis pass 10/10: searching contiguous code area
> Last pass done
Background analysis ended in 4157ms
Now, if you’ve never worked with assembly code before you will probably be very confused with what you’re seeing. For those who are new to assembly, assembly code is essentially an intermediate format of code – it’s what the code you wrote in your language of choice gets converted into when compiled. Obviously, it’s a lot harder to read and write than a standard programming language. For iOS apps, the assembly we see is ARM assembly. For those with a formal computer science education, you probably have seen either MIPS or x86 assembly in school before – if you’re familiar with either of these, ARM shouldn’t be too hard to get a hang of. Getting in depth on ARM would simply not fit into this post, so I will refer you to this great tutorial here by Azeria-Labs (https://twitter.com/azeria_labs) if you’re interested in learning more about it.
2: Running lldb
‘lldb’ is a debugger that is similar to gdb, although commands differ.
Sometimes, what’s going on in a method seems pretty obvious, usually by the name of the method and its return value type (viewed in the dumped headers), or by skimming through its assembly code. But, there are times where it won’t be so clear what’s going on, and stepping through the execution with lldb can help you understand how it works.
To setup lldb, you’ll first want to check if you have ‘debugserver’ installed on your phone. To check, ssh in and go to ‘Developer/usr/bin’. Then check if the ‘debugserver’ binary file exists. If not, you’ll need to install it:
- Open up XCode, and create a new project
- With your device connected via USB, try to build/run the app on your device. You should see in the top bar ‘Preparing debugger support for iPhone…’. Once this is done, you should now have ‘debugserver’ on your device
Now you’ll need to do some quick setup on your Mac. In Terminal, run:
iproxy 1337 1337 &Note: If you get ‘Command Not Found’, you’ll need to install iproxy:
brew install usbmuxdYou can choose any port number not in use, as long as you use the same one in the next steps.
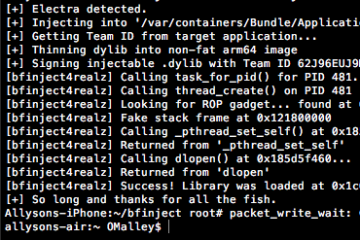
Now, while ssh’d into your phone, you’ll need to fetch the PID of your target app. The quickest way to do this is by running:
ps aux | grep AppNameThe PID will be the first number displayed in the output.
Now, still on your device, run:
/electra/jailbreakd_client <PID> 1Then:
/Developer/usr/bin/debugserver localhost:1337 -a <PID> Now your phone is ready, and we can start lldb on the computer:
lldbNext you’ll want to tell lldb about your target:
platform select remote-iosAnd finally, connect to the target app’s process:
process connect connect://localhost:1337Now, you should see output indicating a successful connection, with the app’s execution paused:

3: Debugging with lldb
Before we begin trying to debug the app, we need to take care of one more obstacle – app store apps will nearly always have ASLR enabled. For those unfamiliar with ASLR, it stands for ‘Address Space Layout Randomization’. It’s a security mechanism designed to protect against exploits by randomizing the address that the app’s code will start at – this means that each time you run the app, all methods and code sections will begin at a different address. To get around this and still be able to debug the app, we need to calculate the ASLR’s offset each time we run it.
In lldb, run:
image dump sections AppNameYou will get output that looks like this:

We are interested in the two highlighted values.
To calculate the offset, open up your favorite hex calculator and compute ‘Red – Blue’ (from the above image):
0x0000000102b54000 - 0x0000000100000000
Note down the resulting value. For me, this is 0x2b5400. This will be the offset.
Now, choose a method that you’d like to set a breakpoint in. In Hopper, search for the method name and go to it’s implementation:

Note down the address of the start of the method. (In the above case, it’s 0000000100a88220)
Now back in lldb, you can set a breakpoint by running:
br s -a 0x2b54000+0x0000000100a88220Note that the first value is the offset we calculated, and the second value is the entry point of the method I want to debug. If you don’t see any error messages, you should be good to go. Type ‘c’ to resume the app’s execution.
Now, in the app, navigate to where you expect the method to be called. In this case, I’ll tap the login button. When I do that, lldb should pause execution at your breakpoint:

And now you can begin debugging!
Here are some of the most useful commands:
sSteps into the next instruction. You can call this repeatedly to watch the execution flow.
cResumes execution until the next breakpoint is hit.
register read -ADisplays the contents of each register. This is useful for viewing arguments, local variables, and return values. You can call this after each invocation of ‘s’ to get a sense of what is happening at each step.
po $regRead the value stored in an individual register. Replace ‘reg’ with the name of the desired register
register write reg 123Write a new value to a register. This is useful for replacing arguments, return values, or other local variables.
As usual, this only scratches the surface of lldb’s capabilities. For further reading, here is a useful command map which also shows equivalent commands in gdb for those with experience in gdb:
https://lldb.llvm.org/lldb-gdb.html
This concludes Part 4, and the series. Happy hacking!